
2026 Income Limits & AMI Tables for Texas
2026 AMI income limits (30/50/60/80%) for affordable apartments by Texas metro and household size. Updated annually from HUD/TDHCA.

Why These Numbers Move Every Year
HUD publishes Area Median Income (AMI) limits every spring for every metro in the United States. TDHCA (Texas Department of Housing and Community Affairs) aligns Texas-specific figures for state-financed properties.
That means the qualification math for income restricted apartments changes at least once a year, and it changes differently in each metro. Someone who didn’t qualify in 2025 might qualify now, and vice versa.
The Five Texas Metros We Cover
Each of these metros has its own AMI, updated annually:
- Austin-Round Rock MSA (highest AMI of the five)
- San Antonio-New Braunfels MSA
- Houston-The Woodlands-Sugar Land MSA
- Dallas-Fort Worth-Arlington MSA (Dallas and Fort Worth share one number)
Austin runs highest, San Antonio typically lowest. Houston and DFW are usually similar to each other and above San Antonio.
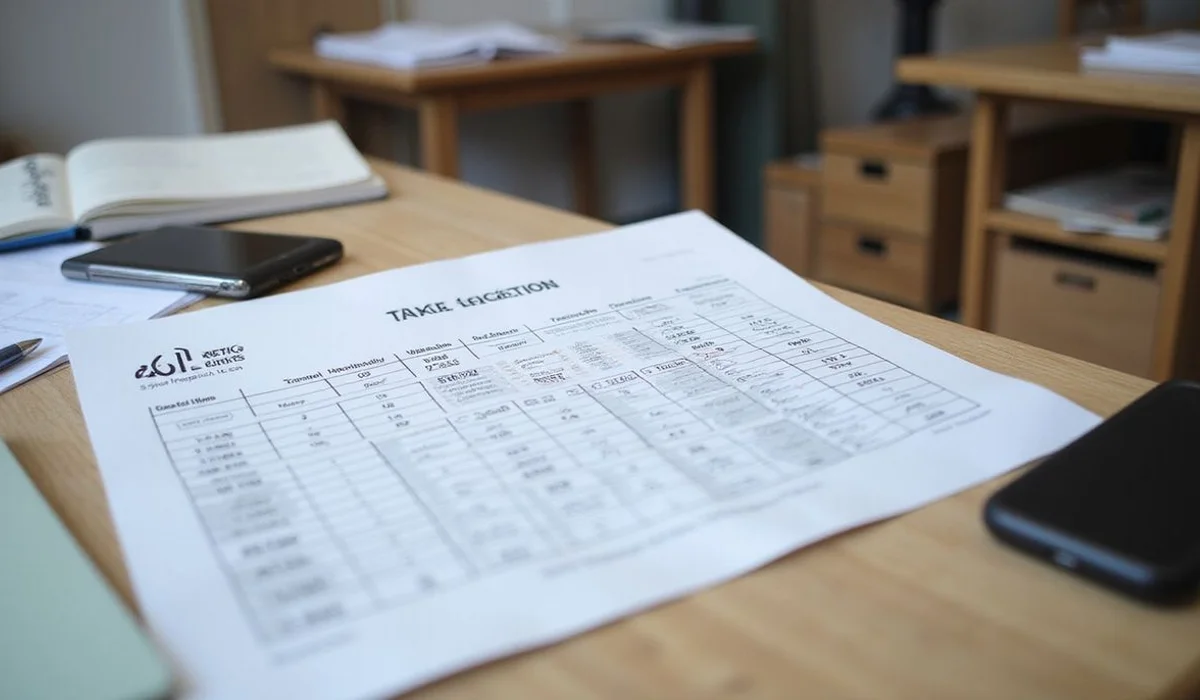
Why We Don’t Post Specific Dollar Figures Here
Two reasons:
Accuracy. Numbers change every year, and stale numbers mislead people about qualification. A printed 2024 figure would be wrong within a year.
Case-by-case work. Your qualifying tier depends on metro, household size, program, and any deductions (medical, dependent care). A static table can’t tell you what a 5-minute intake can.
We do maintain a professional-facing quick reference for case managers and PHA staff. If you’re a housing navigator, see the For Professionals hub.
Household Size Scale (Same Every Year)
While the base AMI moves annually, the household-size scaling stays roughly constant:
| Household Size | Approximate Adjustment |
|---|---|
| 1 person | ~70% of the 4-person figure |
| 2 people | ~80% |
| 3 people | ~90% |
| 4 people | 100% (base) |
| 5 people | ~108% |
| 6 people | ~116% |
| 7 people | ~124% |
| 8 people | ~132% |
That’s why “AMI table” is really a grid: rows by household size, columns by AMI tier (30/50/60/80%), one grid per metro.
What Each Tier Buys You
- 30% AMI: Deepest affordability. Reserved units.
- 50% AMI: Common LIHTC tier for general and family.
- 60% AMI: The single most common LIHTC tier.
- 80% AMI: Workforce housing. Higher qualifying income, higher rent cap.
How We Use These Numbers
When you submit the free intake, we run your metro, household size, and income against current HUD/TDHCA published limits. Within a few minutes we can tell you:
- Which AMI tiers you qualify at
- Whether workforce (80%) units might fit better than deep-subsidy (30-50%)
- Whether you’re near the ceiling and might edge out with a raise
- Whether combining a voucher would open more options
The Practical Path
Rather than trying to reverse-engineer the year’s tables yourself, start the intake and let us match your household to the tier you actually qualify at.